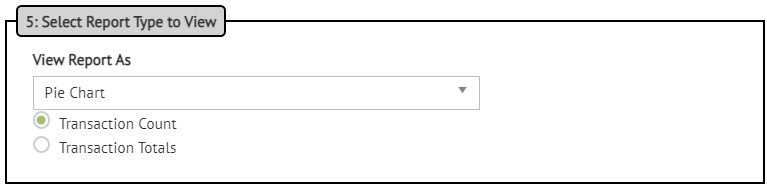
5:Select Report Type to View
The View Report As dropdown field is optional when composing a report. If the selected Report Type is a Summary Report, you can display the data in a variety of graphical formats.
Where:
|
Chart Type |
Description |
|
List |
Returns data in grid / spreadsheet format. |
|
Pie Chart |
Returns a pie chart. The number of wedges is determined by parameters such as number of trading partners, whether a task has been completed or not, etc. |
|
Line Graph |
Returns data as a line graph separated by Action Date, which is defined by your Show Data By field selection. |
|
Bar Chart |
Returns data as a bar chart separated by Action Date, which is defined by your Show Data By field selection. |
Use the radio buttons to select how your data is to be represented:
|
Transaction Count |
Shows count of transactions in the specified timeframe broken down by trading partner and transaction type. |
|
Transaction Totals |
Shows total dollar amount that the transactions in the specified timeframe total up to by trading partner and transaction type. |
Data is grouped in the following order:
-
Trading Partner
-
Transaction Type
-
Store Number (if selected)
-
Activity (if selected)
-
Activity Status (if selected Completed/Not completed)
-
Activity Date (if activity selected and date range is not All) or Creation Date (if no activity selected and date range is not All)
|
NOTE The Transaction Report is displayed on a separate page. Use buttons to change the graphical representation of the data from among the viewing options: List, Pie Chart, Line Graph, and Bar Chart. The returned data can also be switched from/to Transaction Count or Transaction Totals.
|
Next
Go to Advanced Options when your selections are complete.
Related Topics